Intuitively Understandable HTML Content
4.85/5 (14 votes)
Making HTML intuitively understandable using CSS and JavaScript.
Introduction
I want to introduce a few ways to use intuitively understandable user interface (IUUI) in JavaScript. What is IUUI? The answer is multilateral. One of the directions of IUUI is to emphasize important content and degrade the less valuable. I want to show you how to do it in the next examples where I'm using the I2UI JavaScript library.
Tags Cloud
Let's create a tags cloud for German states by population. A simple tag is presented by the name of the state and its font size, font weight, and opacity based on the state's population.
Here is a table of German state by population:
| State | Population |
| Baden | 10717000 |
| Bavaria | 12444000 |
| Berlin | 3400000 |
| Brandenburg | 2568000 |
| Bremen | 663000 |
| Hamburg | 1735000 |
| Hesse | 6098000 |
| Mecklenburg | 1720000 |
| Lower Saxony | 8001000 |
| North Rhine | 18075000 |
| Rhineland | 4061000 |
| Saarland | 1056000 |
| Saxony | 4296000 |
| Saxony-Anhalt | 2494000 |
| Schleswig | 2829000 |
| Thuringia | 2355000 |
For start, need to add link to JavaScript library:
<script type="text/javascript" src="http://i2ui.com/Scripts/Downloads/i2ui-1.0.0.js"></script> Then, we need to create an HTML structure for tags cloud:
<div>
    <span>Baden</span>
    <span>Bavaria</span>
    <span>Berlin</span>
    <span>Brandenburg</span>
    <span>Bremen</span>
    <span>Hamburg</span>
    <span>Hesse</span>
    <span>Mecklenburg</span>
    <span>Lower Saxony</span>
    <span>North Rhine</span>
    <span>Rhineland-Palatinate</span>
    <span>Saarland</span>
    <span>Saxony</span>
    <span>Saxony-Anhalt</span>
    <span>Schleswig</span>
    <span>Thuringia</span>
<div>
Now, we can define a CSS which would belong to the lowest rate tag and highest rate tag. In other words, this is the range from one CSS selector to another CSS selector.
.fromStyle
{
    font-size:10px;
    font-weight:200;
    opacity:0.5;
}
.toStyle
{
    font-size:35px;
    font-weight:600;
    opacity:1;
}
Now, we can indicate the CSS range and tags rates on HTML:
<div data-i2="css:['.fromStyle','.toStyle']">
    <span data-i2="rate:10717">Baden</span>
    <span data-i2="rate:12444">Bavaria</span>
    <span data-i2="rate:3400">Berlin</span>
    <span data-i2="rate:2568">Brandenburg</span>
    <span data-i2="rate:663">Bremen</span>
    <span data-i2="rate:1735">Hamburg</span>
    <span data-i2="rate:6098">Hesse</span>
    <span data-i2="rate:1720">Mecklenburg</span>
    <span data-i2="rate:8001">Lower Saxony</span>
    <span data-i2="rate:18075">North Rhine</span>
    <span data-i2="rate:4061">Rhineland</span>
    <span data-i2="rate:1056">Saarland</span>
    <span data-i2="rate:4296">Saxony</span>
    <span data-i2="rate:2494">Saxony-Anhalt</span>
    <span data-i2="rate:2829">Schleswig</span>
    <span data-i2="rate:2355">Thuringia</span>
<div>
As you can see, the tags rate is "thousands" of population. It doesn't matter what would be here, "thousands" or "numbers" of population. The main idea is to have the same ratio between rates.
In the end, we need to call the next JavaScript function which means "emphasize":
i2.emph();
So, the tag with the smallest rate gets the fromStyle CSS properties, the tag with biggest rate gets the toStyle CSS properties. Thus the tags with rates between the above edges get CSS properties that depend on their rates.

Number Magnitude Emphasizing
When you take a look at the last table's population numbers, it's hard to recognize quickly the exact amount of people in each state. Now, let's observe an alternative way to present numbers based on their magnitude.
Let's redo the previous table into the following HTML code:
<table data-i2="css:[{fontSize:'10px',},{fontSize:'30px'}]">
   <tr>
       <td>Baden</td><td data-i2="number:10717000"></td>
    </tr>
   <tr>
       <td>Bavaria</td><td data-i2="number:12444000"></td>
    </tr>
   <tr>
       <td>Berlin</td><td data-i2="number:3400000"></td>
    </tr>
   <tr>
       <td>Brandenburg</td><td data-i2="number:2568000"></td>
    </tr>
   <tr>
       <td>Bremen</td><td data-i2="number:663000"></td>
    </tr>
   <tr>
       <td>Hamburg</td><td data-i2="number:1735000"></td>
    </tr>
   <tr>
       <td>Hesse</td><td data-i2="number:6098000"></td>
    </tr>
   <tr>
       <td>Mecklenburg</td><td data-i2="number:1720000"></td>
    </tr>
   <tr>
       <td>Lower Saxony</td><td data-i2="number:8001000"></td>
    </tr>
   <tr>
       <td>North Rhine</td><td data-i2="number:18075000"></td>
    </tr>
   <tr>
       <td>Rhineland</td><td data-i2="number:4061000"></td>
    </tr>
   <tr>
       <td>Saarland</td><td data-i2="number:1056000"></td>
    </tr>
   <tr>
       <td>Saxony</td><td data-i2="number:4296000"></td>
    </tr>
   <tr>
       <td>Saxony-Anhalt</td><td data-i2="number:2494000"></td>
    </tr>
   <tr>
       <td>Schleswig</td><td data-i2="number:2829000"></td>
    </tr>
   <tr>
       <td>Thuringia</td><td data-i2="number:2355000"></td>
    </tr>
</table>
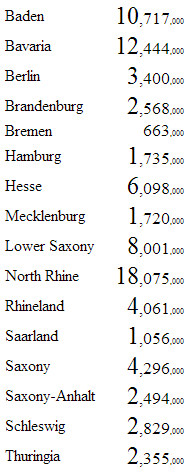
Here is the result:

In this table, a quick look indicates that numbers are about millions, only Bremen has a few hundred thousand people. The highest number magnitudes are emphasized and the lowest are degraded. Thus, the user quickly detects the whole "picture" of the previous table.
Tag Group Emphasizing
What if we need to emphasize not just a simple tag, but a group of tags? Furthermore, let's imagine we have to represent each state with this HTML:
<div>
    <span>Baden</span><br/>
    <span>10717000</span>
</div>
What if we need to display a block size, name's span, and population's span based on population? The issue is solved with "sets". Each "set" is a separate CSS range for the defined tags. Let's look at the example:
<div data-i2="css:{block:['.fromBlock','.toBlock'],name:['.fromName','.toName'],pop:['.fromPop','.toPop']}">
    <div data-i2="rate:10717,set:'block'">
        <span data-i2="rate:10717,set:'name'">Baden</span><br/>
        <span data-i2="number:10717000,set:'pop'"></span>
    </div>
    <div data-i2="rate:12444,set:'block'">
        <span data-i2="rate:12444,set:'name'">Bavaria</span><br/>
        <span data-i2="number:12444000,set:'pop'"></span>
    </div>
    <div data-i2="rate:3400,set:'block'">
        <span data-i2="rate:3400,set:'name'">Berlin</span><br/>
        <span data-i2="number:3400000,set:'pop'"></span>
    </div>
    <div data-i2="rate:2568,set:'block'">
        <span data-i2="rate:2568,set:'name'">Brandenburg</span><br/>
        <span data-i2="number:2568000,set:'pop'"></span>
    </div>
    <div data-i2="rate:663,set:'block'">
        <span data-i2="rate:663,set:'name'">Bremen</span>
        <br/>
        <span data-i2="number:663000,set:'pop'"></span>
    </div>
    <div data-i2="rate:1735,set:'block'">
        <span data-i2="rate:1735,set:'name'">Hamburg</span><br/>
        <span data-i2="number:1735000,set:'pop'"></span>
    </div>
    <div data-i2="rate:6098,set:'block'">
        <span data-i2="rate:6098,set:'name'">Hesse</span><br/>
        <span data-i2="number:6098000,set:'pop'"></span>
    </div>
    <div data-i2="rate:1720,set:'block'">
        <span data-i2="rate:1720,set:'name'">Mecklenburg</span><br/>
        <span data-i2="number:1720000,set:'pop'"></span>
    </div>
    <div data-i2="rate:8001,set:'block'">
        <span data-i2="rate:8001,set:'name'">Lower Saxony</span><br/>
        <span data-i2="number:8001000,set:'pop'"></span>
    </div>
    <div data-i2="rate:18075,set:'block'">
        <span data-i2="rate:18075,set:'name'">North Rhine</span><br/>
        <span data-i2="number:18075000,set:'pop'"></span>
    </div>
    <div data-i2="rate:4061,set:'block'">
        <span data-i2="rate:4061,set:'name'">Rhineland</span><br/>
        <span data-i2="number:4061000,set:'pop'"></span>
    </div>
    <div data-i2="rate:1056,set:'block'">
        <span data-i2="rate:1056,set:'name'">Saarland</span><br/>
        <span data-i2="number:1056000,set:'pop'"></span>
    </div>
    <div data-i2="rate:4296,set:'block'">
        <span data-i2="rate:4296,set:'name'">Saxony</span><br/>
        <span data-i2="number:4296000,set:'pop'"></span>
    </div>
    <div data-i2="rate:2494,set:'block'">
        <span data-i2="rate:2494,set:'name'">Saxony-Anhalt</span><br/>
        <span data-i2="number:2494000,set:'pop'"></span>
    </div>
    <div data-i2="rate:2829,set:'block'">
        <span data-i2="rate:2829,set:'name'">Schleswig</span><br/>
        <span data-i2="number:2829000,set:'pop'"></span>
    </div>
    <div data-i2="rate:2355,set:'block'">
        <span data-i2="rate:2355,set:'name'">Thuringia</span><br/>
        <span data-i2="number:2355000,set:'pop'"></span>
    </div>
</div>
Set is defined in the parent div tag. To indicate the tag that belongs to a specific set, we need to add the set property inside the tag attribute: data-i2.
Then, we need to specify the CSS ranges:
div
{
    display:inline-block;
    text-align:center;
    vertical-align:middle;
    color:white;
}
.fromBlock
{
    border:1px solid #665E7C;
    border-radius:1px;
    background-color:#A87EBC;
    width:90px;
    height:50px;
    margin:1px;
}
.toBlock
{
    border:10px solid #21007F;
    border-radius:20px;
    background-color:#57007F;
    width:220px;
    height:100px;
    margin:10px;
}
.fromName
{
    font-size:12px;
    color:#CECECE;
}
.toName
{
    font-size:40px;
    color:#FFFFFF;
}
.fromPop
{
    font-size:10px;
    color:#D3CCAD;
}
.toPop
{
    font-size:30px;
    color:#FFD800;
}
As you may recognize, the first selector is about the "block" style, the others are about CSS ranges.
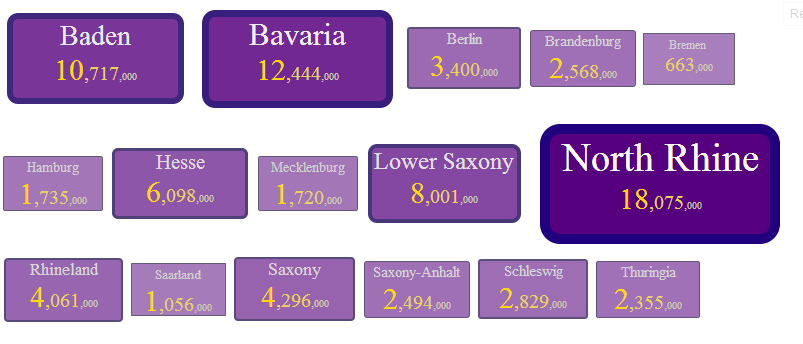
Let's see the result:

Awesome, the states with higher population number are emphasized with color brightness and sizes.
