
Comparison Chart for Two Different Time Frames in SSRS
4.29/5 (5 votes)
Comparison Chart for Two Different Time Frames in SSRS
Introduction
Sometimes we need to create a chart for compare data between two different time frames. I can’t find any complete procedure to do that in the web. So in this step by step tutorial I will try to create such a chart.
Background
Suppose we want to create a bar chart that compare the data between two different time frames like the data between 2013-07-01 to 2013-08-06 and 2014-07-01 to 2014-08-06. In this article we try to create a bar chart using this two different time frames data.
Steps
Add Report
Add a new blank report to the project. We just want to create the report from the scratch so we select Report option not Report Wizard.

Add Data Source
After add the report to the project, first we need to add the data source. We can use relation database to analysis service as a data source. In our case we use SSAS as data source. In the ‘Report Data’ pane of the added report right click on ‘Data Sources’ folder and add a new data source. Choose appropriate name for the data source and select one of the option. We can use embedded connection that will be dedicated only for this report or can use shared data source reference which can be used by all the report of the project.

Add Data Sets
In this step we need to add data sets which actually retrieve the actual data using the data source. Since we want to compare the data between two time frames, we need to add two data sets for two data frames.
Now add data set for first time period. Right click on ‘Datasets’ folder icon in the ‘Report Data’ pane and select the appropriate name and data source.
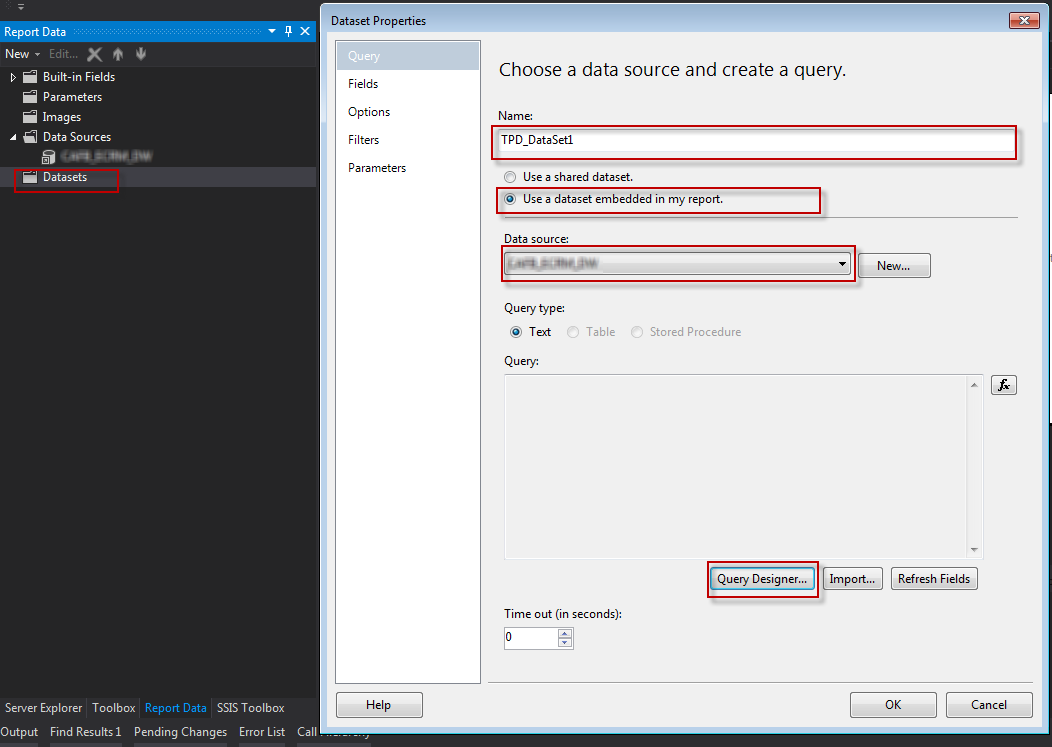
Clicking on ‘Query Designer’ button in the ‘Dataset Properties window’ will forward you to the query designer window. From the query designer window prepare your desired query. I have added a date hierarchy of time dimension for filtering the data. This filter property will be used for select time period. You can also use any kind of query here.

Now add the second data set and query for second time period.

Look at that, for filtering I use TimeKey hierarchy of Time dimension for this query but use Date hierarchy for previous query. But why I do that? Because SSRS automatically generate the parameter and it use the dimension name and hierarchy name for this auto generated parameter name (like FromTimeTimeKey & ToTimeTimeKey for the above query). And if the parameter generates for the first query it will not generate again for the second query (in this case two queries get the same value for the parameter). So I use different hierarchy so that different parameter generates for different query.
Add Chart
Now we add our example chart. To add the chart right click on blank portion and add a chart.

When you click chart option of the previous window you will be forwarded to the 'Select Chart Type' window. From this window you can select any kind of chart. Select your appropriate chart. I use bar chart for our example report.

Add Data to the Chart
After adding the chart if we see the preview we can not see anything meaningful
After adding the chart if we see the preview we cannot see anything meaningful because we cannot add any data to the chart so far. So let's add data to the chart. To do that double click the chart and it will open the ‘Chart Data’ window in the right side. From the ‘Chart Data’ add values like the below image. When we try to add values, we can see two data sets, both are available to select. We choose first data set which will fetch the data for the first time period.

Now we have to add another value for second dataset. Since we want the chart must compare the data between two time frame so we do not use second data sets property directly. Rather we use SSRS lookup function which will fetch the matching product categories data. To do that follow the below image.

Click the expression and put lookup expression for the second values.

Finally select the Category Groups and Series Groups as like the below image.

If we see the preview of the report the report looks like the below image.

See it shows the same data and same legend. The reason behind this is the legend by default use the main data set in our case first data set. Since the first data sets retrieve the data for the year 2013, both legend show the year 2013. Let’s fix it. Right click the first value and select ‘Series Properties…’. From this window select legend and click the expression button.

Here we have to use custom expression so that the legend show our desired data. The first legend must show the first data set field so we explicitly tells it to show that by specifying the data set name.

Similarly change the second legend value.


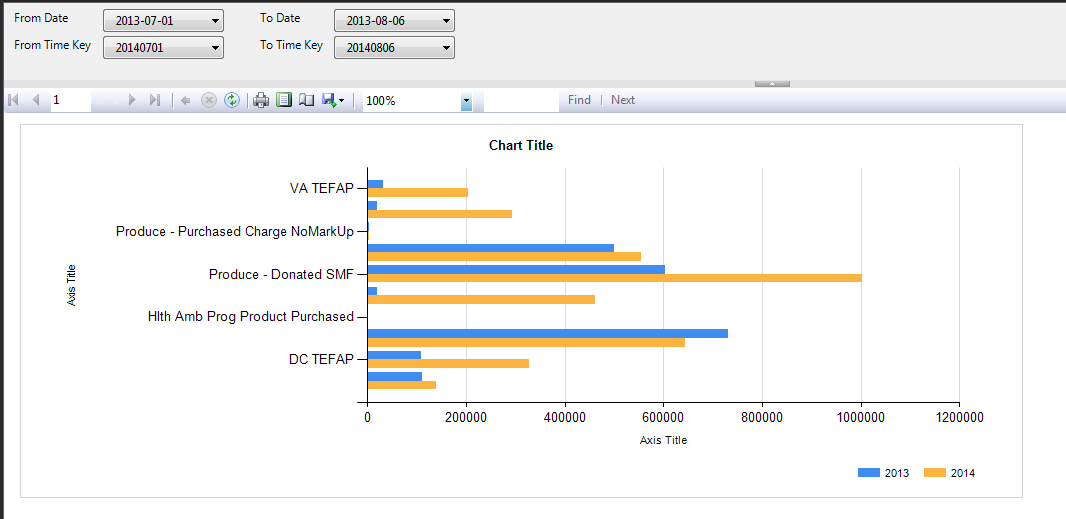
Now if we preview the report again it will show the perfect data.

Finally let's change the legend position so that it show in the bottom right side. To do that right click on legend and select ‘Legend Properties…’ and follow the below image. Of course we can place the legend any where we want.

Our final report looks like the below image.
References
SSRS Function: https://msdn.microsoft.com/en-us/library/ee210531.aspx