
Timeline
4.79/5 (12 votes)
Sep 3, 2007
5 min read
121513
3564
A WinForms control for displaying time series diagrams.
- Download source files - 57.8 KB
- Download sample application - VTAView - 18.8 KB
- Download sample application - ProcessMonitor - 13.7 KB
Introduction
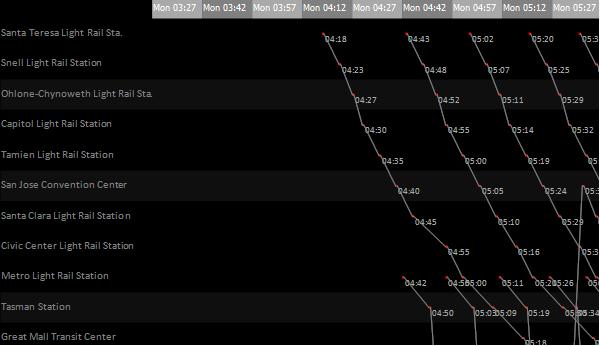
The image seen above should be familiar to folks who have read, or glanced the cover of Edward Tufte's The Visual Display of Quantitative Information. It is a time series, showing the schedule of two routes of Santa Clara VTA's (Valley Transportation Authority) graphically. The image was generated by the first sample application (VTAView), which uses Timeline, a customizable, interactive, WinForms control that I wrote for displaying time series diagrams. Timeline can display static information known beforehand, like that of a timetable, as well as information that changes as time progresses.
ProcessMonitor, the second sample application, makes use of a timer and the Timeline control to create a dynamic time series diagram to show variation in resources used by a process across time. This article describes the design of the control and its usage in applications.
Design
The implementation of Timeline is based on the idea of a time window showing a section of the total time (world time). The time window shows the visible portion of the total time and all operations like scrolling and zooming work on the time window. Data items are added to the time series by providing a data provider to the control. The control manages the display of data items, depending on the current time window. This design allows the world time to be potentially infinite and this allows creation of time series diagrams that dynamically add information as time progresses. The class diagram below shows the classes and interfaces in the control.
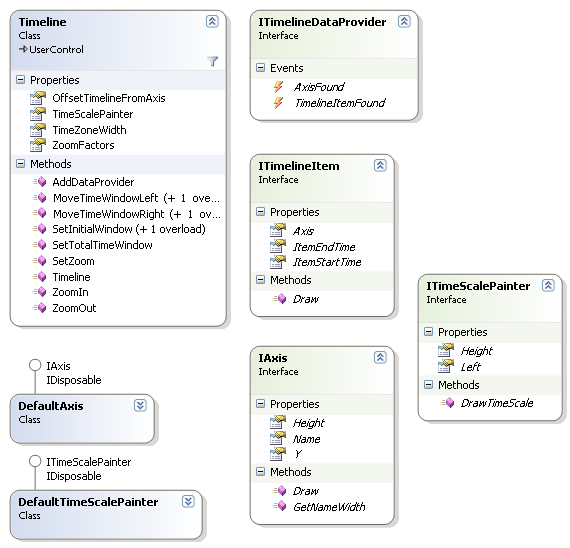
The main class, Timeline, has the following properties:
OffsetTimelineFromAxis: This boolean property controls whether the time series is drawn inline or offset from the axis labels.True
False
TimeScalePainter: Allows customized drawing of the timescale (at the top). The default implementation,DefaultTimeScalePainter, draws the timescale like this: .
. Consumers of the control can implement the
ITimesScalePainterinterface, or subclassDefaultTimeScalePainter, to customize the way it is drawn.TimeZoneWidth: The width of a time zone (one division of the time scale).ZoomFactors: The list of stepping factors to be used when zooming, in minutes. For example, setting this to{1.0/60, 1, 5, 15, 30, 60}results in the ability to zoom in until each time zone represents a second (1/60), and zoom out upto an hour, with the intermediate factors being1,5,15and30minutes. The current zoom factor controls how much time each timezone represents.
The methods in the control are:
AddDataProvider: This is the single most important method in the class, taking an implementation of theITimelineDataProviderinterface as its parameter. The data provider is responsible for adding data items to the time series.MoveTimeWindowLeft: Moves the time window to the left. The overload without a parameter moves it left by one timezone, (the time represented by the time zone depends on the current zoom level), and the other overload moves it left by the specified number of minutes. Dragging the mouse across the control also moves the time window.MoveTimeWindowRight: Moves the time window to the right. Dragging the mouse across the control also moves the time window.SetInitialTimeWindow: Sets the time window's starting time and the zoom factor to be applied (or the ending time) when the control is initialized for the first time.SetTotalTimeWindow: Sets the world start and end time. The time window cannot be moved outside the world time.ZoomIn: Decrements the zoom factor index by one, resulting in each time zone representing a smaller unit of time.ZoomOut: Increments the zoom factor index by one, resulting in each time zone representing a larger unit of time.
Interfaces
Using the control requires implementation of the following interfaces:
ITimelineDataItem
ITimelineDataItem represents one data item in the time series. Timeline gets a list of ITimelineDataItems from the data provider and renders them on the screen if they lie within the current time window. In the image shown at the beginning of the article, each stop is a data item and is given to the control as a TrainStopItem class, implementing the ITimelineDataItem interface. The interface has three getters:
Axis: returns the axis that this data item belongs to. In the sample image, each train station is an axisItemStartTime: returns the starting time of this itemItemEndTime: returns the ending time of this item
It has one method, Draw, that implementors use to generate the visual representation of the item. Here's how TrainStopItem's Draw method is implemented:
public void Draw(System.Drawing.Graphics g,
    TimeToXCoordinateDelegate timeToLocationConverter, float yStart,
    float height, DateTime currentWindowStart, DateTime currentWindowEnd)
{
    float startX = timeToLocationConverter(start);
    float endX = timeToLocationConverter(end);

    float y = yStart + height / 2;

    using (Pen p = new Pen(Color.Red, 2))
    {
        g.DrawLine(p, startX, y, endX, y);
    }

    using (SolidBrush brush = new SolidBrush(Color.DarkGray))
    {
        g.DrawString(this.end.ToString("HH:mm"), new Font("Calibri", 7),
                new SolidBrush(Color.DarkGray), endX, y);
    }


    if (nextStop != null)
    {
        using (Pen p = new Pen(Color.Gray, 1))
        {
            g.DrawLine(p, endX, y, timeToLocationConverter
                (nextStop.ItemStartTime), nextStop.Top);
        }
    }
}
ITimelineDataProvider
This interface is used to provide information about the axes and data items to Timeline. The interface consists of two events, AxisFound and TimelineItemFound, that implementors can fire to inform the control about the discovery of a new axis or a data item. In the VTAView sample application, MainForm implements the interface and fires the events when loading the schedule from disk.
The reason why the data provider has events, instead of methods like GetAxes and GetTimelineItems, is that in certain kinds of applications using the control, the list of items and axis will not be available statically. The second sample application, ProcessMonitor, is a good example of those kinds of applications. ProcessMonitor shows dynamically changing parameters like processor usage and handle count for a process, and informing Timeline about new data points is best achieved through events.
Putting it all together
Here's a step by step guide to using the control in an application:
- Write classes implementing
ITimelineItemto represent data items. - Write one or more data provider classes implementing
ITimelineDataProvider. Use theAxisFoundevent to return instances ofIAxisderived classes and theTimelineItemFoundevent to provide instances ofITimelineItemderived classes to the control. - Drag and drop the
Timelinecontrol onto a Form. In theFormclass'sInitializeComponent, use theSetTotalTimeWindowandSetInitialWindowmethods to set the starting and ending times. - Use the
AddDataProvidermethod to link data providers created in (2) withTimeline.
History
- Initial version - 8/26/2007