
Drilldown Report Writer with Charting
4.38/5 (7 votes)
This article describes a template-driven reporting tool which allows drilldown and charting.

Introduction
This article describes a template-driven reporting tool which allows drilldown and charting. Resulting reports may be exported to Excel or XML. It supports MS-SQL Server natively, and Oracle, MySql, etc. through ODBC.
Using the Code
Default.aspx shows you what you have to do to select a report. Basically, you are navigating to Reports/Reporter.aspx with a query string parameter telling which report to process. The reporting tool and all report templates are kept in their own folder so that reporting may be easily added to any existing project.
The following is a sample report template. You provide the complete HTML for the report, so you are completely in charge and can do whatever you want. It is easiest to take one of the samples and modify it for your own use. Tokens of the form @@@xxxxx@@@ are replaced with the report parameters that you have specified.
<html>
<head>
<title>Sales by category</title>
<link id='Link2' href='Reports.css' rel='STYLESHEET' type='text/css' />
<!-- set the css any way you want -->
<style>
BODY, TD
{
font-family: Arial;
font-size: small;
}
.ReportFormatDDL
{
font-size: xx-small;
}
.rowclass_odd
{
background-color: gray;
}
.rowclass_even
{
background-color: lightblue;
}
#title
{
color: Green;
}
#subtitle
{
color: orange;
}
</style>
</head>
<body>
<div id="title" align="center">
Sales by category</div>
<div id="subtitle" align="center">
<!- the parameter section below tells the reporting engine to ask for a
start and end date (into the variable @@@Start_Date@@@ and @@@End_Date,
these values are substituted in the next line -->
(@@@Start_Date@@@ - @@@End_Date@@@)</div>
<!-- this is any old HTML you want to make your report look nice -->
<table align="center">
<tr>
<td>
<div style="width: 150px;">
</div>
</td>
<td valign="center">
<!-- "chart" is a special id. The contents of this div are replaced with the chart.
Notice the "onclick" handler, this causes your drill down menu to appear.
The contents here are just a placeholder so that you can preview the report in Visual Studio.
If id "chart" exists then it must appear before id "table".
The charting div has the following named attributes:
ChartType - one of the MSChart charting types
width - width of the chart
height - height of the chart
xcol = the result set column to use for the x co-ord (origin 1)
ycol - the result set column to use for the y co-ord (origin 1) -->
<div id="chart" ChartType="donut" width="300" height="300" xcol="2" ycol="3"
onclick="ShowMenuEvent(event);" style="cursor: hand;">
<table align="center">
<tr>
<td>
Chart appears here
</td>
</tr>
</table>
</div>
</td>
<td valign="center">
<!-- Here I show you how you can embed another report inside this one.
Note that the variables @@@Start_Date@@@ and @@@End_Date@@@ are substituted
with the currrent reports values so that they will not be asked for again.
Clicking in the iframe will cause a new window to open with this report. -->
<iframe src='Reporter.aspx?
path=MSSQL$Sales$Manager$Sales_by_Customer_ThumbNail_en.html&
format=html&Start_Date=@@@Start_Date@@@&End_Date=@@@End_Date@@@'
style="width: 150px; height: 300px;" frameborder="0"
scrolling="no" marginheight="0"
marginwidth="0"></iframe>
</td>
</tr>
</table>
<!-- "table" is a special id. Its cotents are replaced with the reports tabular data -->
<table id="table" border="1" style="border-collapse: collapse" align="center">
<thead>
<tr>
<td>
</td>
<td style="font-weight: bold">
Category
</td>
<td style="font-weight: bold">
Sales
</td>
</tr>
</thead>
<tbody>
< the first TR of the TBODY defines the template to use to display odd
numbered rows -->
<!-- the first column of the data result set must be an identity column used for drill down.
@@@1@@@ is replaced by the identity column for each row -->
<tr class="rowclass_odd" onclick="ShowMenu(this, '@@@1@@@');"
style="cursor: hand;">
<td>
<!-- @@@row@@@ is a special variable containing the current row number.
You can also use it to create unique ids if you need them for some reason -->
@@@row@@@)
</td>
<td style="font-weight: bold">
<!-- column 2 of the result set is substituted here -->
@@@2@@@
</td>
<td align="right"
id="some_unique_id_@@@row@@@">
<b>$</b>@@@3@@@
</td>
</tr>
<!-- This is the template for the even numbered rows -->
<tr class="rowclass_even" onclick="ShowMenu(this, '@@@1@@@');"
style="cursor: hand;">
<td>
@@@row@@@)
</td>
<td style="font-weight: bold">
@@@2@@@
</td>
<td align="right">
<b>$</b>@@@3@@@
</td>
</tr>
</tbody>
<tfoot>
<tr>
<td>
</td>
<td>
Totals
</td>
<!-- The footer row can contain summary data for a column (like Excel).
The formula value can be: sum, count, avg. -->
<td formula="sum">
<b>$</b>@@@3@@@
</td>
</tr>
</tfoot>
</table>
<!-- You can export the report to Excel or xml. -->
<table align="center">
<tr>
<td>
<select name="format" onchange="document.forms[0].submit();">
<option value="">Export to ...</option>
<option value="xls">excel</option>
<option value="xml">xml</option>
</select>
</td>
</tr>
</table>
<!-- This is your drill down menu -->
<div id="menu" class="DDL_Menu" style="position: absolute; top: 300;
left: 0; display: block;
width: 300px" onclick="CloseMenu();" runat="server">
<fieldset style="background-color: lightblue;">
<legend style="color: black">Drill-down menu </legend>
<table id="menutable">
<tr>
<td>
<!-- @@@1@@@ is substituted with the identity column of the row that the menu
has been displayed for __>
<a style="color: black; text-decoration: none"
onclick="return(DoDrillDown(this));"
href="Reporter.aspx?path=MSSQL$Sales$Manager$Sales_by_
Product_by_Specific_Category_en.html&Category=@@@1@@@"
target="_blank">Sales by Products by Specific Category</a>
</td>
</tr>
<tr>
<td>
<a style="color: black; text-decoration: none"
onclick="return(DoDrillDown(this));"
href="Reporter.aspx?path=MSSQL$Sales$
Manager$Sales_by_Customer_by_Specific_Category_en.html
&Category=@@@1@@@"
target="_blank">Sales by Customer by Specific Category</a>
</td>
</tr>
</table>
</fieldset>
</div>
<script>
// we left the drilldown menu visible for design purposes, hide it!
document.getElementById("menu").style.display="none";
</script>
</body>
<div style="display: none">
<!-- These are the parameters that will be asked for when the report is run -->
<div id="parameters">
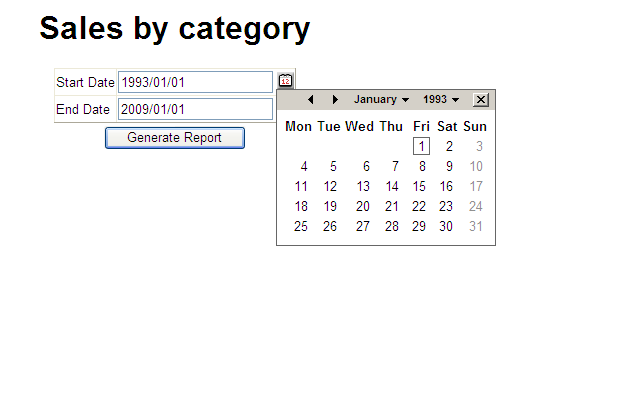
<parameter name="Start_Date" type="date" default="1993/01/01" />
<parameter name="End_Date" type="date" default="2009/01/01" />
</div>
<div id="data">
<!-- This is the SQL that will be executed to generate the report data.
In this example I am using named parameters (@Start_Date, etc) just to show how it is done,
but you can use positional parameters (as you must for ODBC type connections) -->
<series sql="EXEC Report$Sales$Manager$Sales_by_Category_en
@Start_Date='@@@Start_Date@@@', @End_Date='@@@End_Date@@@'" />
</div>
</div>
</html>
Parameters
The parameter section allows you to define the parameters which will be asked for when the report runs. Each parameter has the following attributes:
name- the name of the parameter. When displayed, all underscores are replaced with spaces, so "Start_Date" displays as "Start Date".type- the parameter type. Supported values are:date,int,bigint,money,real,float,string.droplist- creates a dropdown list, e.g.:droplist="select val, txt from table order by txt".default- the default value to originally select in a droplist, e.g.:default="some text".
Here is a sample:
<parameter name="My_List" type="string" droplist="select val,
	txt from table order by txt" default="some text" />
Before prompting for a parameter value, the reporting engine tries to satisfy the parameter values
by matching the parameter name with a corresponding cookie, session, form variable or querystring variable (in that order).
CustomerHelpers.GetParam contains the algorithm. Change it to suit your needs.
For example, if you have a multi-department site and you want to restrict the viewable data for a logged in employee to her own department, then create a cookie called DepartmentId and ensure that DepartmentId is a parameter to the Stored Procedure or select statement that gets the result set.
The reporting engine will always satisfy the DepartmentId parameter with the cookie value.
Getting Other Variables
There will be times when you need more information. For example, you may have the identity value for a category but you need its name. Add the following to the template (see ODBC$Sales$Manager$Sales_by_Product_by_Specific_Category_en.html):
<div id="sets">
<!-- @@@Category@@@ is a parameter to this report -->
   <set name="CategoryName" sql="select CategoryName from Categories
	where CategoryId=@@@Category@@@" />
   <set name="SomeOtherVariable" sql="EXEC SomeStoredProcedure @@@Category@@@,
	@@@SomeOherInputParamter@@" />
</div>
Accessing your Database
Web.config contains an appsettings section, like this:
<appSettings>
<add key="DBType" value="ODBC"/>
<add key="MSSQLConnStr" value="Data Source=DRYDEN-D6A544AB\SQLEXPRESS;
	Initial Catalog=NorthWind;User Id=sa;Password=pwd;"/>
<add key="ODBCConnStr" value="DSN=NorthwindODBC;Uid=sa;Pwd=pwd;"/>
</appSettings>
Choose DBType of "ODBC" or "MSSQL" and set the appropriate connection string.
The sample stored procedures (in the folder (SPs) run against the Northwind database, which is not included in the zip file, but can be downloaded from here.
Adding native support for other database types:
The files DBMsSql.cs and DBOdbc.cs are good examples of how little code you need to write to natively support any database with a .NET provider.
Security
CustomerHelpers.cs contains a static method named CanAccess. It has a single parameter which is the filename name of the report that is being run. You may want to use cookies, session variables and login information to determine if the user is allowed to run the specified report.
Returns true if the report can run, otherwise false.
Tip: If you name your reports as follows: Report$Department$Role$ReportName_Language.html, then you can use cookies and session variables to determine if the logged in user should be able to run the specified report.
Language
If you suffix the report name with a two character language code, e.g.:
Reports/ODBC$Sales$Manager$Sales_by_Customer_by_Specific_Category_en.html
Reports/ODBC$Sales$Manager$Sales_by_Customer_by_Specific_Category_fr.html
then the report parameters and column titles can be tailored to a specific language.
Charting
Charts are built with the freely downloadable MSChart.exe and MSChart_VisualStudioAddOn.exe.
See this article to get you started with charting. I suggest you build your own charting project before you try using charting in the reporting engine as there is a bit of a learning curve to getting charting installed and working correctly.
Thumbnailing
In the example provided above, the second chart was in an iframe and when you click on it, it expands in another window.
The expansion works because the charting div in the iframe contains an onclick handler
(see ODBC$Sales$Manager$Sales_by_Customer_Thumbnail_en.html) which actually opens up a new window with a different report (see ODBC$Sales$Manager$Sales_by_Customer_en.html).
Conclusion
I hope you enjoy using this reporting tool. If you have any suggestions for improvement, please contact me. If you make any changes (e.g.: add a new formula type or add a new native database provider), please send it along and I'll incorporate it into the source code (with full bragging rights going to you!).
History
- 25th February, 2010: Initial version