Introduction
This paper will focus on using the Debugging Tools for Windows console debugger in order to understand memory corruption. The contents will touch on the basics of program segmentation, the Windows Memory Manager, the Windows Heap Manager, and how to step through an application if you suspect memory corruption. Some basics about memory allocation and the Windows Memory Manager are necessary, however.
Some Words on Program Segmentation
When a program is loaded into memory, it is broken down into pieces. The .text section corresponds to the code segment and is read-only. The write-to mechanism has been disabled and writing to the .text section will cause a segmentation fault. Its size is fixed at runtime when the process is loaded. The .data section is used to store global initialized variables, such as int a = 0; the variable has been both declared and initialized. Its size is also fixed at runtime. The .bss section is used to store global uninitialized variables, such as int a. The heap section is used to store dynamically stored variables and grows from the lower-addressed memory to the higher-addressed memory spaces. The stack is used to keep track of function calls (recursively, that is, it is read from bottom to top – thread call stacks are the key to find out why a process hangs). A buffer can be likened to a horizontal array of storage bytes used to receive and hold data until it can be used by a process.
The Windows Operating System Maps Virtual Address Spaces to Physical Address
A fundamental aspect of memory analysis is that the location of data used by the operating system is not the same as the physical locations needed to locate data in a memory dump. Because there is not enough physical memory to contain all processes running simultaneously, the Windows operating system must simulate a larger memory space. The Windows Memory Manager creates the illusion of a flat, virtual address space, when in fact the hardware unit of the microprocessor maps the virtual addresses to the physical addresses. It does this in the granularity of a page. One page is four kilobytes of physical memory. This memory scheme is called Demand Paged Virtual Addressing: when an executable is loaded, only pieces of the executable are loaded during initialization. The appropriate DLL is also “virtually loaded” – only the referenced part is loaded at this point, not the entire DLL. Once features of the executable are used and more functionality is called to be imported, other pieces of the executable are read onto disk as needed, as well as the appropriate DLLs. Any memory that can be shared is shared: code and DLLs. Since a single instance of one DLL can be referenced by several processes, the DLL is loaded only once into physical memory, so the processes can reference the pages as needed. Therefore the process of simulating a larger memory space is accomplished through a series of data structures: the two main structures are the page directory and the page table. To locate data in, say, a memory dump, it is necessary to translate virtual addresses to physical addresses.
Recall that part of a process’s virtual address space is private to that process. The virtual addresses used by a process do not represent the actual physical location of an object. Instead, the system maintains a page map for each process, which is an internal data structure used to translate virtual addresses into corresponding physical addresses. Each time a thread references an address, the system translates the virtual address to a physical address. The most accurate view of these private bytes (as they are called) to a process are seen in the private bytes, private bytes delta, and private history columns which are configured in Process Explorer, a freeware tool written by mark Russinovich. Select “View”, and then “Select Columns”. The amount of physical memory assigned to each process is called its “working set”. The system commit limit prevents processes from growing, as all processes are monitored by the Memory Manager to record memory demands and paging rates.
Each process starts with an empty or zero size working set. As the threads that run within the process begin to touch virtual addresses (birth of a working set), the working set begins to grow. When the memory manager decides a working set is big enough, then the memory manager will begin to pull out from the working set the oldest pages first, pages that have not been accessed for a long time. When they are pulled, however, they are not zeroed out or destroyed because they represent a copy of the data that was once being referenced by that process. So Windows keeps these on several lists. Understanding these lists is the key to understanding how to use the Performance and Reliability Monitor. In order to understand these counters, we need to understand the amount of physical memory in the system that is not owned by a process. Windows does this by organizing unowned pages by type:
- Free Page List
- Zero Page List
- Modified Page List
- Standby List
When Windows pulls out a page from a working set of a process, it is pulling out a page that the process has not said that it will not need to reuse. Such a page is cached data. It is either on the Standby (clean) list or the Modified (dirty) list ready for reuse by another process if the page represents code of part of a DLL (recall shared memory). The list that the page goes to depends on whether it has been modified or not. If it has been written to, then the memory manager has to make sure that the page gets back to the file where it came from. That file might be a file from like a data file that is mapped into the process’s address space. If the page has been modified but does not represent a data file from disk, then it could represent private data to a process that it might want to use again. The pages that have been modified and returned to the working set are called soft faults (not paging file reads or mapped-file reads) because there is no hard disk I/O involved – they are simply inserted back into the working set. If the data being referenced is no longer in memory because it is now back in the file on disk or the paging file, then the system would incur a hard page fault and do a paging read operation.
The Free Page List does not exist when the system starts, it grows only when private memory is returned to the system. In other words, private process memory is never given back to the system without first being zeroed. This should make sense. If the data was private to the process alone (like the text typed in a notepad.exe file), it must be zeroed out because it cannot be shared. Windows goes to the Free List when it has to do a page read because a page fault is occurring as the memory manager is going to do an I/O that is going to completely overwrite the contents of a page. Now when the Free List gets to a certain size, there is a kernel-mode thread that is awakened called the zero page thread (zero priority). The thread’s job is to zero out the dirty pages because the Free list has gotten too high, and when Windows needs zeroed out pages, it has them readily on hand.
The Windows Heap Manager
Whenever the need arises to create data structures whose size cannot be determined statically when a program is being built, the program requires some form of dynamic memory management. A heap is a form of memory manager that an application can use to allocate and free memory dynamically. As said, the heap grows from lower memory addresses to the upper memory addresses, while the stack does the reverse. It is not possible for them to grow into each other, however. Memory is normally allocated in powers of two and when the amount is not known ahead of time and the size of memory does not fit on the stack (automatic memory), the heap is used. Heaps are Windows objects and Windows maintains pools of memory in heaps. A process can contain several heaps, and you allocate memory from one of these heaps. Memory can be requested from the C runtime, the virtual memory manager, or some other forms of private memory managers. The operational requirements determine if programmers use only the process heap and the C library. The initial heap size, which can be zero and is always rounded up to a multiple of the page size, determines how much physical storage (in a paging file) is committed to the heap. That is, the required space allocated from the heap. As a program exceeds the initial size, additional pages are committed automatically up to a maximum size. Having said that, we must know to break these concepts down to the thread execution, as it is normally writing to a block of memory that it does not own that corrupts the state of the memory block. Suffice it to say that pointers are used to reference memory that contains the memory locations to objects. Rather than moving data around, the operating system uses pointers.
When a process is loaded, the heap manager automatically creates a new heap called the default process heap. As the working set grows, its size for any process is constantly adjusted by Windows. These adjustments may occur because of changes in system load and process priority. Every process has a handle table. Whenever a thread opens a resource, a handle is created in the process’s handle table that has a value that the thread can reference in order to continually access that resource. An operating resource can be a file object, a registry key, a TCP/UDP port, a device, etc. Whenever a process is hung, the key is to examine the thread call stack. Read this stack from the bottom to the top. Whenever an executing thread writes to a block of memory it does not own, it will likely corrupt the state of that block of memory. An application can crash outright, or partly run and behave strangely. Below is code referenced from “Advanced Windows Debugging” that simulates a memory corruption scenario:
#include <windows.h><windows.h />
#include <conio.h><stdio.h />
#include <stdio.h><conio.h />
VOID SimulateMemoryCorruption ( ) ;
class CAppInfo
{
public:
CAppInfo(LPWSTR wszAppName, LPWSTR wszVersion)
{
m_wszAppName=wszAppName;
m_wszVersion=wszVersion;
}
VOID PrintAppInfo()
{
wprintf(L"\nFull application Name: %s\n", m_wszAppName);
wprintf(L"Version: %s\n", m_wszVersion);
}
private:
LPWSTR m_wszAppName ;
LPWSTR m_wszVersion ;
} ;
CAppInfo* g_AppInfo ;
int __cdecl wmain (int argc, WCHAR* args[])
{
wint_t iChar = 0 ;
g_AppInfo = new CAppInfo(L"Memory Corruption Sample", L"1.0" );
if(!g_AppInfo)
{
return 1;
}
wprintf(L"Press: \n");
wprintf(L" 1 To display application information\n");
wprintf(L" 2 To simulated memory corruption\n");
wprintf(L" 3 To exit\n\n\n>");
while((iChar=_getwche())!='3')
{
switch(iChar)
{
case '1':
g_AppInfo->PrintAppInfo();
break;
case '2':
SimulateMemoryCorruption();
wprintf(L"\nMemory Corruption completed\n");
break;
default:
wprintf(L"\nInvalid option\n");
}
wprintf(L"\n\n> ");
}
return 0;
}
VOID SimulateMemoryCorruption ( )
{
char* pszWrite="Corrupt";
BYTE* p=(BYTE*) g_AppInfo;
CopyMemory(p, pszWrite, strlen(pszWrite));
}
To compile:
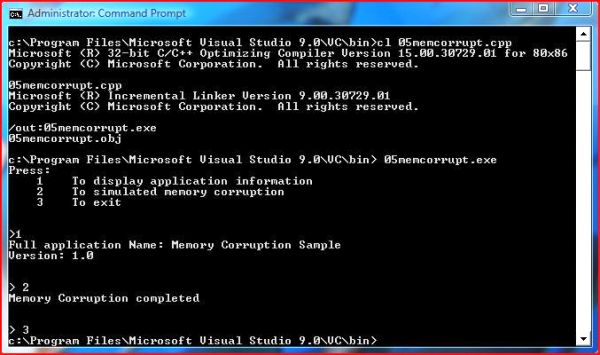
The application contains a class (CAppInfo) that encapsulates the application-specific information (application name and version information). Notice that it prints this application information to console screen, but if the option 1 is pressed again, it crashes. This example, taken from “Advanced Windows Debugging”, written by Mario Hewardt and Daniel Pravat (with a forward from Mark Russinovich), can be stepped though the console debugger, cdb.exe, to find out which part of the application caused the memory corruption.
c:\Program Files\Debugging Tools for Windows>md c:\symbols

c:\Program Files\Debugging Tools for Windows>set _NT_SYMBOL_PATH=srv*c:\symbols*
http://msdl.microsoft.com/download/symbols

c:\Program Files\Debugging Tools for Windows>cdb.exe 05memcorrupt.exe

Microsoft (R) Windows Debugger Version 6.8.0004.0 X86
Copyright (c) Microsoft Corporation. All rights reserved.

CommandLine: 05memcorrupt.exe
Symbol search path is: srv*c:\symbols*http://msdl.microsoft.com/download/symbols

Executable search path is:
ModLoad: 01000000 01005000   05memcorrupt.exe
ModLoad: 772b0000 773d7000   ntdll.dll
ModLoad: 77430000 7750b000   C:\Windows\system32\kernel32.dll
ModLoad: 75e50000 75efa000   C:\Windows\system32\msvcrt.dll
(1420.143c): Break instruction exception - code 80000003 (first chance)
eax=00000000 ebx=00000000 ecx=0006fb08 edx=77309a94 esi=fffffffe edi=7730b6f8
eip=772f7dfe esp=0006fb20 ebp=0006fb50 iopl=0         nv up ei pl zr na pe nc
cs=001b  ss=0023  ds=0023  es=0023  fs=003b  gs=0000             efl=00000246
ntdll!DbgBreakPoint:
772f7dfe cc              int     3
From the breakpoint exception code 80000003 and the int 3 instruction, it turns out that debugger automatically breaks in after initializing the process before execution begins. Note the ntdll!DbgBreakPoint thread on.
0:000> g
Press:
    1    To display application information
    2    To simulated memory corruption
    3    To exit

>1
Full application Name: Memory Corruption Sample
Version: 1.0

> 2
Memory Corruption completed

> 1(1420.143c): Access violation - code c0000005 (first chance)
First chance exceptions are reported before any exception handling.
This exception may be expected and handled.
eax=72726f43 ebx=72726f43 ecx=00000007 edx=00000073 esi=7ffffffe edi=010012bc
eip=75e5bbb1 esp=0006fa4c ebp=0006fed0 iopl=0         nv up ei pl nz na po nc
cs=001b  ss=0023  ds=0023  es=0023  fs=003b  gs=0000             efl=00010202
msvcrt!_woutput_l+0x983:
75e5bbb1 66833800        cmp     word ptr [eax],0         ds:0023:72726f43=????
0:000> kb
ChildEBP RetAddr  Args to Child
0006fed0 75e63dae 75ef0978 01001288 00000000 msvcrt!_woutput_l+0x695

0006ff18 0100154a 01001288 72726f43 00741dc8 msvcrt!wprintf+0x35
0006ff2c 010014b5 00000031 00741dc8 00741dc8memcorrupt!CAppInfo::PrintAppInfo+0x18
0006ff44 01001731 00000001 00741d60 00744cf0 05memcorrupt!wmain+0xb2
0006ff88 77474911 7ffdf000 0006ffd4 772ee4b6 05memcorrupt!wmainCRTStartup+0x12f
0006ff94 772ee4b6 7ffdf000 7737ccca 00000000 kernel32!BaseProcessStart+0x12f
From the stack, as we read from the bottom, we can see that the main function calls the PrintAppInfo function of the CAppInfo class. So why does the wprintf function fail? We know that wprintf, like wchar_t, expects wide characters, or two byte characters: Unicode or some two byte variation of Unicode like UTF-8. This encoding is not in alignment with ISO-8559 or ASCII plain text. Looking at the parameters passed to wprintf(), we can see two pointers, and it would therefore stand to reason that these two pointers are invalid. The wprintf() function assumes that the pointer passed represents a wide character string that is NULL terminated. So we examine the state of the object:
0:000>x 05memcorrupt!g_*
000210080 05memcorrupt!g_AppInfo = 0x00032cb0

0:000>dt CAppInfo 0x00032cb0
  +0x000 m_wszAppName     : 0x72726f43    ? ?
  +0x004 m_wszVersion     : 0x01747075    ? ?
The question marks mean that the memory is not accessible. The first time the application ran, it printed out everything. The second time we ran the application, the pointers now point to inaccessible memory; a memory block that it does not own. So rather than the “du” commands to dump Unicode, we use the ‘da’ command to dump the plain text:
da 00x00032cb0
00032cb0   "Corrupt………"
So what is the moral of this story? Use memory corruption tools like Application Verifier!
References
- Advanced Windows Debugging, written by Mario Hewardt and Daniel Pravat
- SysInternals Video Library, by Mark Russinovich and David Solomon

